Profiling TPC-H
We are using the TPC-H benchmarking dataset provided by Snowflake to demonstrate AutomateDV and showcase the Data Vault architecture running on Snowflake.
The data comes in 4 different sizes, we will be using the smallest in this guide, TPCH_SF10 which contains 60 million rows in its largest table.
Our aim is to simulate day-feeds into the Data Vault to demonstrate the loading process in a production environment. Before we begin, the data needs to be profiled to identify patterns in the data that could be used to help build the Data Vault and create an accurate simulation.
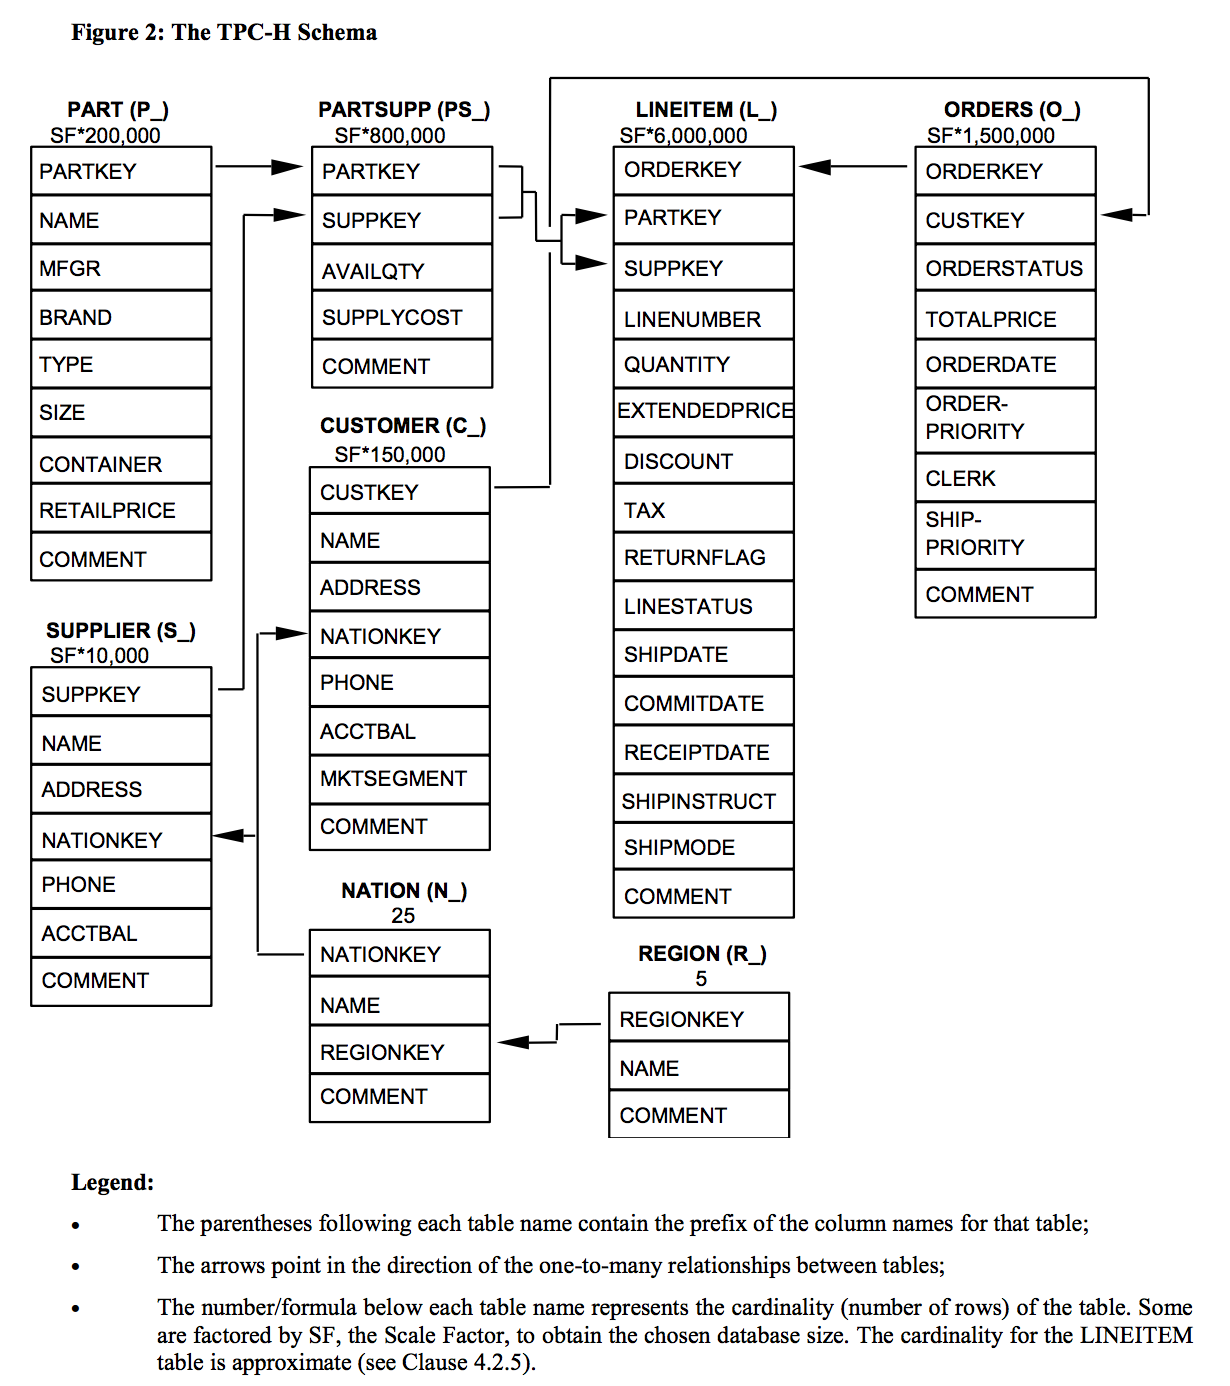
The below diagram describes the TPC-H system.
 (source: TPC Benchmark H Standard Specification)
Date fields
There are a total of four date fields in the data set.
Three of these are found in the LINEITEM table:
SHIPDATECOMMITDATERECEIPTDATE
And one in the ORDERS table:
ORDERDATE
Through querying the data, we discovered that the dates behave as expected and appear in chronological order
the majority of the time: ORDERDATE, SHIPDATE, RECEIPTDATE, COMMITDATE, with COMMITDATE
occasionally going against this pattern.
This pattern allows us to simulate a system feed over multiple days, but we need to know the range of dates
for the simulation to be accurate. We queried the data to find the maximum and minimum ORDERDATE and work out the
difference between them. We found the dates spanned around 6.59 years, or 2405 days.
Relationships
Working out relationships between tables and fields is a key step in mapping an existing system to Data Vault, as it ensures an accurate model of the system is built.
Orders and Suppliers
We first looked at the relationship between orders and suppliers by doing inner joins on
the LINEITEM and ORDERS table, with the SUPPLIER table and counting the distinct suppliers for each order.
We discovered that it is a one to many relationship: an order can contain parts which are from different suppliers.
Customers and Orders
Next we looked at the relationship between customers and orders. We wanted to check whether any customers exist without orders.
We did this by doing a left outer join on the ORDERS table, with the CUSTOMER table and discovered that several
customers exist without orders.
Transactions
To create Transactional Links in the demonstration project, we needed to simulate transactions, as there are no suitable
or explicit transaction records present in the dataset. There are implied transactions however, as customers place orders.
To simulate a concrete transactions, we created a raw staging layer as a view, called
raw_transactions and used the following fields:
- Customer key
- Order key
- Order date
- Total price, aliased as Amount, to mean the order is paid off in full.
- Type, a generated column, using a random selection between
CRorDRto mean a debit or credit to the customer. - Transaction Date. A calculated column which is takes the order date and adds 20 days, to mean a customer paid 20 days after their order was made.
- Transaction number. A calculated column created by concatenating the Order key, Customer key and order date and padding the result with 0s to ensure the number is 24 digits long.
The ORDERS and CUSTOMER tables are then joined (left outer) to simulate transactions on customer orders.
Conclusions
To create a source feed simulation with the static data (shown by the logical pattern in the date fields), we can use
the ORDERDATE as a reference date. We can simulate historical data by only loading records before a particular
ORDERDATE. Any records in the history where the SHIPDATE, RECEIPTDATE and COMMITDATE are after
reference ORDERDATE will be included but set to NULL to allow us to simulate existing records being updated
in a new day-feed.
By profiling the relationships we have identified that the PARTSUPP table can more appropriately be referred to as
INVENTORY, since it is a static relationship (there is no date involved and therefore no changes). This means that
data involving the PARTSUPP, SUPPLIER and PARTS tables create an inventory which can be linked
to the LINEITEM table.
The relationship between customers and orders tells us that customers without an order will not be loaded into the Data
Vault, as we are using the ORDERDATE for day-feed simulation.
This also means that we can simulate transactions by using the implication that a customer makes a payment on an order some time after the order has been made.
Now that we have profiled the data, we can make more informed decisions when mapping the source system to the Data Vault architecture.

